Urbana, Illinois, USA
May 2, 2012
According to University of Illinois Extension horticulture educator Martha Smith, about 80 million American gardeners as well as landscapers and people in the green industry use the United States Department of Agriculture (USDA) Plant Hardiness Zone Map (PHZM) to determine which plants should survive the local winter temperatures.
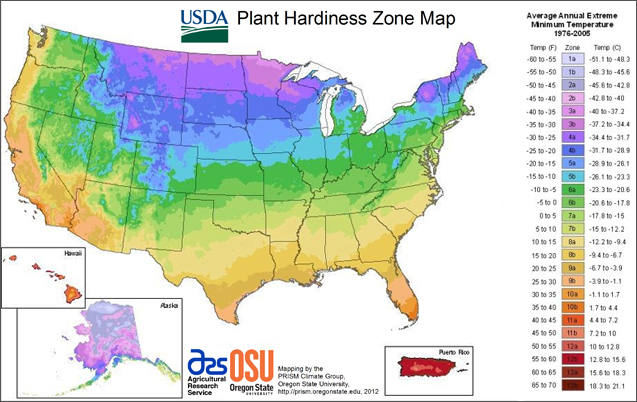
Plant hardiness zone designations represent the average annual extreme minimum temperatures at a given location. They do not designate the coldest temperatures ever experienced but simply the average lowest winter temperature over a specified time.
"There is still a 50 percent chance that winter temperatures could drop lower than the designated zone for a particular area and a 50 percent chance that winter temperatures will be higher," Smith said.
As with the old map, the 2012 map is divided into zones. Each zone is a 10-degree Fahrenheit band and is further divided into A and B 5-degree Fahrenheit zones. The new map includes 13 zones, two more than the old 1990 map. In many areas, these zones have shifted and reflect a 1 to 5-degree Fahrenheit half-zone warmer change (although in some cases, zone temperatures have dropped rather than rising).
As an example, the Quad Cities area and Peoria used to be in USDA hardiness zone 5A with average annual cold temperatures between -15 degrees to -20 degrees F. The new map now lists these counties in zone 5B, which reflects a 5-degree shift warmer with average annual cold temperatures between -10 to -15°F.
Why the differences?
"The new map is based on temperature data from a longer, more recent time period," Smith said. "The 1990 map was based on temperature data from a 13-year period from 1974 through 1986. The new map uses data measured at weather stations over a 30-year period from 1976 through 2005."
More sophisticated methods for mapping zones between weather stations were also used. For the first time, the map takes into account factors such as changes in elevation, nearness to large bodies of water, and the natural change of the land, such as valley bottoms and ridge tops.
Another difference is that the 2012 map does not include Canada or Mexico. The creators focused on providing the best possible information for the United States and Puerto Rico.
What do the changes in the new map mean as far as global warming is concerned?
According to the USDA website, "Climate changes are usually based on trends in overall average temperatures recorded over 50 to100 years. Because the USDA PHZM represents 30-year averages of what are essentially extreme weather events (the coldest temperature of the year), changes in zones are not reliable evidence of whether there has been global warming."
The new map is available at http://planthardiness.ars.usda.gov/PHZMWeb/. For the first time, it is available both as an interactive GIS-based map, for which a broadband Internet connection is recommended, and as static images for users with slower Internet access. Zip codes can be used to find a plant hardiness zone.
"As a 30-year-plus gardening veteran, I find change is good but not always easy to embrace," said Smith. "It will take time not to immediately look for my old zone. I wonder when my flowering dogwood will realize it is 5 degrees warmer in my garden and bloom dependably every spring?"